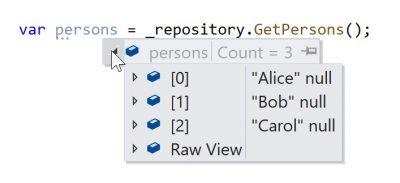
You fetch some data collection from your backend. While debugging, you want to take a peek at the items and then this happens:
var persons = _repository.GetPersons();It’s not possible to inspect the items at a glimpse of an eye. You’ll have to click every item to open its properties. It totally makes sense that Visual Studio does not show any details, because Visual Studio is unaware as to what info might be relevant for your debugging needs.
Well, today is your lucky day, because you are about to discover the DebuggerDisplayAttribute!
Why do we need a designated attribute? Can’t we just override ToString() to achieve that?
Well, you could override ToString(), but ToString() is meant as the default display string.
DebuggerDisplay is meant for debugging. It’s very likely that you might want to have more details for debugging purposes than you want in your ToString(). You can use them both but remember that DisplayDebugger will have precedence by default. This can be overridden in the Visual Studio options under Tools>Options>Debugging and select ‘Show raw structure of objects in variables windows’.
How do we start?
We’ll decorate our class with the DebuggerDisplay attribute:
[DebuggerDisplay("{FirstName} {LastName}")]
public class Person
{
    public string FirstName { get; set; }
    public string LastName { get; set; }
    // ...
}
When we debug our code again, Visual Studio now knows what it needs to display:
 As you can see, the property LastName is null and Visual Studio knows how to display that.
[DebuggerDisplay("{FirstName,nq} {LastName}")]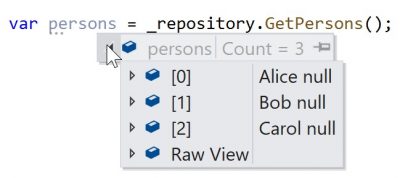
Expressions
The DebuggerDisplayAttribute accepts expressions. You can compare it to interpolation in Angular.
[DebuggerDisplay(“{ 20 + 22 }”)] will display as 42.
In our example, we might want to display the name in uppercase.
[DebuggerDisplay("{FirstName.ToUpper()} {LastName.ToUpper()}")]
public class Person
{
public string FirstName { get; set; }
public string LastName { get; set; }
// ...
}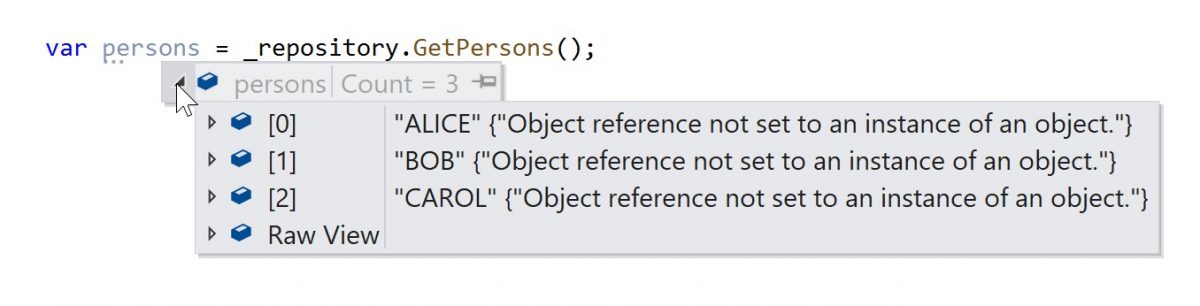 Visual Studio shows us FirstName in uppercase as expected.
LastName however, is shown as the famous error “Object reference not set to an instance of an object” but it does not crash our application.
Be careful
Expressions can be very useful but can come at a cost.
Evaluating the expressions can be a costly operation because the expression will be evaluated every time it is displayed. For complex expressions and large lists, this will slow your debugging performance significantly.
Another reason to avoid expressions is that expressions can change the state of your application at debug time, making it hard to evaluate any bugs.
[DebuggerDisplay("{FirstName,nq} {LastName} {ShoeSize = 100}")]will set every property ShoeSize to 100 when stopping at a break point after class instantiation.
var alice = new Person {FirstName = "Alice", ShoeSize = 38}; Console.WriteLine(alice.ShoeSize);would simply display 38 if ran without debugging. But, as soon as you break after instantiation of alice it will display 100.
Good practice is to create a private property that performs the operation and returns a string with the computed value. This private property is then used to display in the DebuggerDisplay attribute.
[DebuggerDisplay("{DebuggerDisplay}")]
public class Person
{
public Address Address { get; set; }
private string DebuggerDisplay
{
get
{
return string.Format("{0} {1}", Address == null ? "Address is null" : Address.Street, 20+22);
}
}
}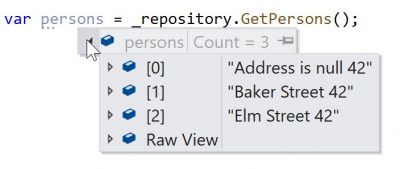 Enjoy the power of the DebuggerDisplay attribute and happy debugging!