Why should we have logging
“A system behaves as it was designed not as it was intended”
For all the good intentions we have when creating a piece of software; there will always be bugs, there will be edge cases we didn’t consider, the users will (ab)use the system in ways that we never considered…
We need logs to know what is going on in our systems once it’s out there. Users won’t remember what they entered, what order they pressed buttons. And they shouldn’t, it’s our responsibility to know what’s going on.
Logging also helps us to become proactive about issues. Done right, we can start fixing issues before users start calling our service desk.
The following tips and tricks will put you on track to have easy and meaningful logs.
Structured logging
“Searching for a needle in a haystack is easier when the haystack is organized”
Plaintext log files are useless! Start using structured logging!
Structured logging is about logging data as if we’re storing it in a database. We’ll be able to query, filter, aggregate, and I don’t know what more, our data.
Use a modern logging library, such as Serilog, and a log server/service that supports it, such as SEQ. They are easy to setup and you’ve got your first logs in seconds. This is what structured logs look like in SEQ:
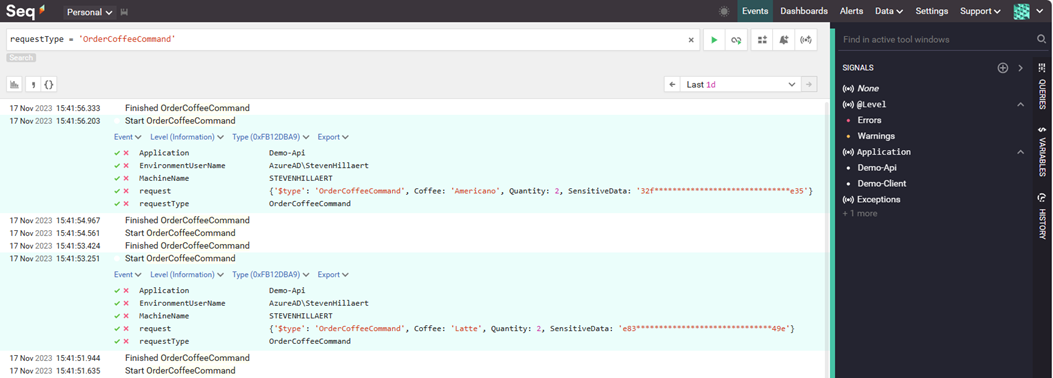 BTW, SEQ has IntelliSense for your properties in the search/filter bar. You see the “request” property with the json value? You can filter on that data as well (f.i. request.Quantity > 2).
Automate logging
“Letting the system write down its own diary, so we don't have to”
In general, we developers are not really thinking about logging. It’s not the most sexy or challenging code and it definitely doesn’t help in reaching the sprint “deadline”. And we’re just plain lazy, but let’s try to be lazy in a smart way.
Automate your logging as much as you can. Plug into the libraries and frameworks you use. Popular tools such as Mediatr and MassTransit allow you to plug into their inner working.
The following Mediatr PipelineBehavior will log every request that is handled by Mediatr.
public class LoggingBehavior<TRequest, TResponse>
    : IPipelineBehavior<TRequest, TResponse>
    where TRequest : IRequest<TResponse>
{
    public async Task<TResponse> Handle(
        TRequest request,
        RequestHandlerDelegate<TResponse> next,
        CancellationToken cancellationToken)
    {
        Log.Information("Start {requestType}", typeof(TRequest).Name);

        var response = await next();

        Log.Information("Finished {requestType}", typeof(TRequest).Name);

        return response;
    }
}
Enrichment
“Sprinkling extra context onto your logs, turning plain notes into enlightening tales”
Another way of automating your logs is enrichment, adding data to every log without explicitly writing it. Enrichment can be done globally or scoped for a piece of code. Just set it up and every log will include this information, we as developers don’t have to think about it anymore.
Machine name, request id, correlation id and user info make suitable candidates for global logging. Serilog supports several of these and it’s easy to create your own.
You can have global enrichment, every log in your application will be enriched with this data. You do this during the setup of the logger:
Log.Logger = new LoggerConfiguration()
            .Enrich.With(new MachineNameEnricher())
            .Enrich.With(new EnvironmentUserNameEnricher())
            .Enrich.FromLogContext()
            .WriteTo.Console()
            .WriteTo.Seq("http://localhost:5341", apiKey: seqApiKey)
            .CreateLogger();
And you can have scoped enrichment, only logs in that scope will receive the additional data. For instance let’s enrich our Mediatr logging with the data of the request:
public class LoggingBehavior<TRequest, TResponse>
        : IPipelineBehavior<TRequest, TResponse>
        where TRequest : IRequest<TResponse>
{
    public async Task<TResponse> Handle(
        TRequest request,
        RequestHandlerDelegate<TResponse> next,
        CancellationToken cancellationToken)
    {
        using (LogContext.PushProperty("request", request, true))
        {
            Log.Information("Start {requestType}", typeof(TRequest).Name);
            var response = await next();
            Log.Information("Finished {requestType}", typeof(TRequest).Name);
            return response;
        }
    }
}
Every log within that “using” scope will be enriched with the serialized data of the request.
Correlation ID’s
“The breadcrumbs that connect the dots, making sense of the journey across system territories”
In distributed systems it’s really necessary to have correlation id’s so that you can correlate logs from different applications and services. You have to be able to trace the handling of a certain event back to its source.
The correlation ID is an immutable id that is generated at the source and is passed whenever crossing an application boundary. When calling an API we add it to the headers, when publishing to a service bus we add it to the message.
This can also be automated, both adding the id to outgoing messages and logging it at the receiver end.
Log decisions
“Mapping out the thought process of your code, so you can trace its every choice and detour”
The previous tips were mainly about automating logs, keeping us developers lazy. Now we really do have to think.
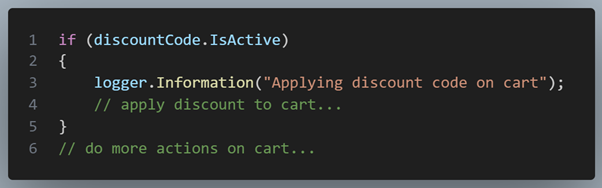
When you make an important decision in your code (if/else, switch case), log it!
Log something when you decide to do something and also log something when you decide NOT to do something. You should be able to follow the executed code by reading the logs.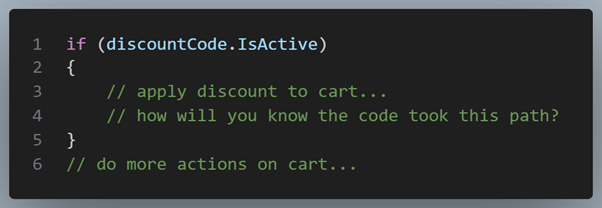 vs
vs
 Real errors
“Like a vigilant guard, only raise the alarm for true threats, not every shadow that passes by”
Errors should be (proactively) acted upon by the team. So don’t flood your system with errors: when everything is an error, nothing is an error.
In general, use correct log levels for your log messages. Use debug, info, warning, error… correctly. Also don’t flood your system with logs you rarely need. SEQ and Serilog allow you to dynamically set the minimum log level of your application at runtime. Normally you log starting from information, when issues start to arise you could temporarily lower the minimum level to debug to get more information. All without deploying or restarting your application.
It’s too easy to setup, just look at the SEQ - Serilog documentation.
Performance metrics
“Catching the subtle hints of wear and tear before they become major roadblocks”
Logging performance metrics is a good idea to proactively fix bottlenecks before users start to complain. Create some dashboards so you can see any performance degradation after a release.
First, don’t use StopWatch but something like Serilog Timings. Second, automate it! This is an updated version of our Mediatr pipeline, the second using statement is the scope that will be timed:
public class LoggingBehavior<TRequest, TResponse>
        : IPipelineBehavior<TRequest, TResponse>
        where TRequest : IRequest<TResponse>
{
    public async Task<TResponse> Handle(
        TRequest request,
        RequestHandlerDelegate<TResponse> next,
        CancellationToken cancellationToken)
    {
        using (LogContext.PushProperty("request", request, true))
        {
            using (Log.Logger.BeginTimedOperation("Mediatr handler", warnIfExceeds: TimeSpan.FromMilliseconds(200)))
            {
                Log.Information("Start {requestType}", typeof(TRequest).Name);
                var response = await next();
                Log.Information("Finished {requestType}", typeof(TRequest).Name);
                return response;
            }
        }
    }
}
Fancy tip, use the “warnIfExceeds” to log the timing as a warning if a threshold is exceeded.
Performance impact
“Capturing every brushstroke of a masterpiece; beautiful in detail but demanding on the canvas of performance”
Structured logging makes it tempting (and easy) to log an entire object (graph). This can have an impact on performance and resources! Don’t log binary data, large object graphs and avoid circular references.
I've had this issue twice. The first time it was very difficult to find the problem, who would suspect a log statement right? I had to analyze a memory dump to find the issue.
Log what you really need to know. You can exclude certain properties with attributes, limit the depth of your graph in logs or even use separate log models
public class OrderCoffeeCommand : IRequest<OrderCoffeeResponse>
{
    public string Coffee { get; set; }
    public int Quantity { get; set; }

    [NotLogged]
    public string Base64EncodeFile { get; set; } = "This should never be logged";
}
Sensitive data
“Like accidentally dropping your diary in a public square, some pages are best kept private”
Probably quite a few people have access to the log server: developers, service desk,.... These people should be able to see and analyse the logs but NOT any sensitive information. Make sure that passwords, api keys, credit cards… are not logged!
Again, logging entire objects makes logging easy but that doesn't mean we don’t have to think about the consequences.
Log what you need and exclude sensitive information. Use attributes to exclude or obfuscate information.
public class OrderCoffeeCommand : IRequest<OrderCoffeeResponse>
{
    public string Coffee { get; set; }
    public int Quantity { get; set; }

    [LogMasked(ShowFirst = 3, ShowLast = 3, PreserveLength = true)]
    public string CreditCardNumber { get; set; }
}
Conclusion
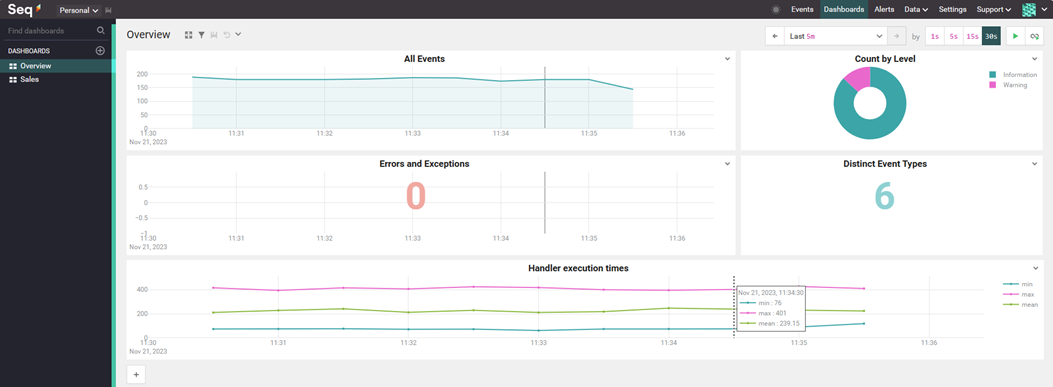
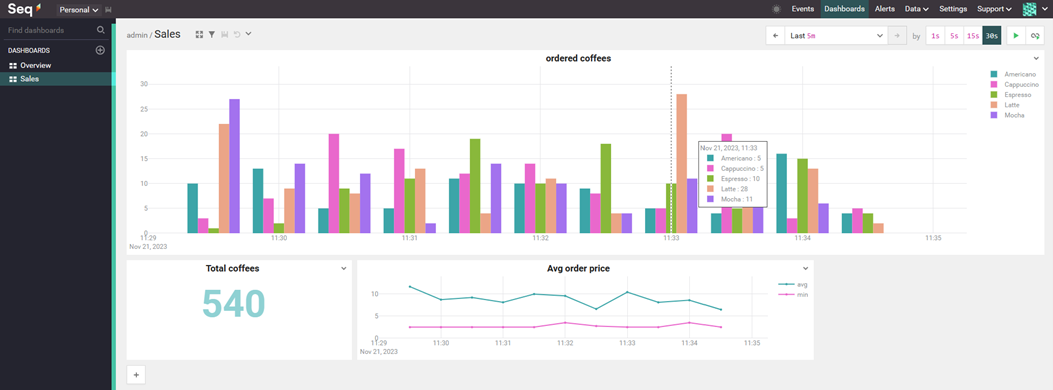
With these tips & tricks you should be able to create logs that are not only useful when issues arise, but they actually become valuable assets to both the development team and business users. Create dashboards and cast them in the dev room. Or even make dashboards for your sales people. Setup alerting based on certain log messages entering your system and start fixing errors before users notice.
 Effective logging practices are a testament to our commitment to quality, reliability, and user satisfaction in the software we create and maintain.
Happy logging, and may your logs always be as insightful as they are instrumental!